
Basics of Statistics
Basics of Statistics: Overview
This topic covers concepts such as Statistics, Representation of Data, Representation of Discrete Data, Tabular Representation of Data, Ungrouped Frequency Distribution, Grouped Frequency Distribution Having Discrete Classes, etc.
Important Questions on Basics of Statistics
Direction: Study the following chart to answers these questions. Slum Population as a percent of the total population
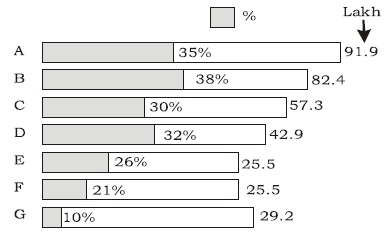
The difference in the slum populations of city G and city F is equal to_____.
Direction: Study the following chart to answers these questions. Slum Population as percent of total population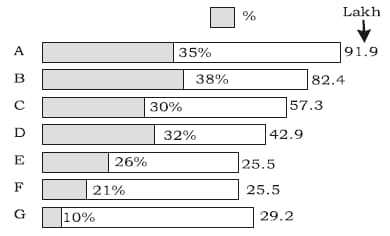
The city with the highest slum population was
____means separating items according to similar characteristics grouping them into various classes.
You are an auditor of a firm and the firm earns a profit you stated to them that the annual profit is . This is_________ type of statics.
The average of salaries in a factory is . The statement that the average salary is __________
Seasonal variations can occur within a period of
The sale of cold drink could go up in summers and go down in the winters is an example of _____.
The mean of the observations be . Then, the mean of observations is
Which graph is used to represent data in continuous elements?
Classify the following variables as discrete and continuous.
Annual salary of all the workers in a company.
Classify the following variables in discrete and continuous.
Temperature recorded in NYC throughout the day.
The intersection point of less than ogive and more than ogive gives::
The different flavours of ice creams cones sold in a fair is given:
| Ice cream flavour | Butterscotch | Vanilla | strawberry | Kesar-pista | Fruit and nut | Black berry | Chocolate |
| Number of cones |
Represent the data in a proper chart.
Explain different ways to represent discrete data.
Number of girls in different classes of a school are given. Represent the data by a bar graph
| Number of girls | ||||||||||
| Class |
The following data relate to the marks of a group of students :
| Marks : | Below | Below | Below | Below | Below |
| No. of student : |
How many students got marks more than
The number of accidents for seven days in a locality are given below:
| No. of accidents : | |||||||
| Frequency : |
What is the number of cases when or less accidents occurred?
Cost of sugar in a month under the heads raw materials, labour, direct production and others were and units respectively. What is the difference between the central angles for the largest and smallest components of the cost of sugar?
A sample study of the people of an area revealed that total number of women were and the percentage of coffee drinkers were as a whole and the percentage of male coffee drinkers was What was the percentage of female non-coffee drinkers?


